The Projection Line: Why It Waits, and How It Learns
Greg Oehmen - Founder, RunnersRun · Apr 22, 2026
If you've been using your RunnersRun dashboard for a week or so, a new line has probably shown up on your Pace Line Graph — a dashed one, in a lighter shade. That's the Projection Line, and it's the closest thing the product has to an answer for "where am I actually going to finish?"
It's also the part of the dashboard that generates the most questions. Why didn't it appear earlier? Why does it barely move in the first few weeks, even when I've been crushing it? And why does it sometimes ignore a really good week?
All of that is deliberate. Here's what it's doing.
Quick recap: the two lines you already know
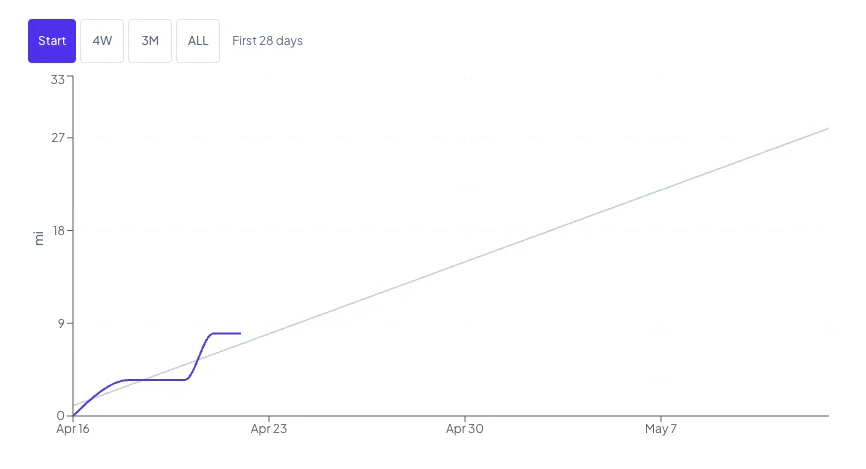
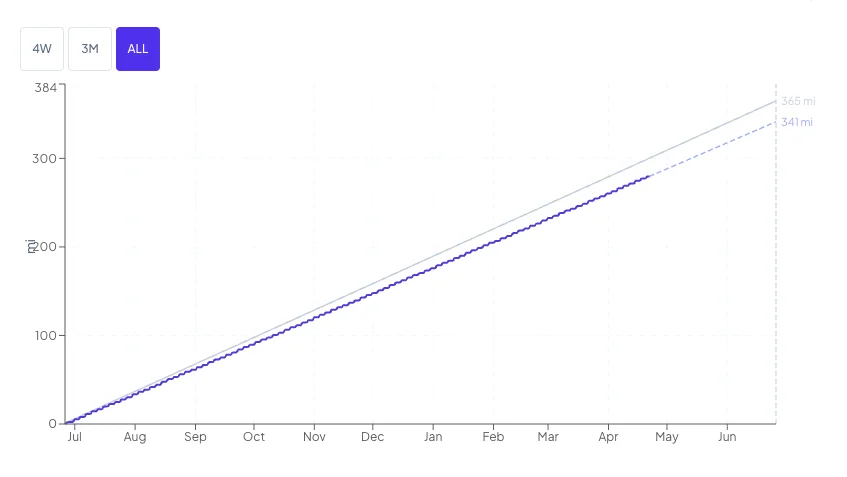
The Trend Line (solid, slate-colored) is the steady diagonal rising from zero to your goal target. It's the pace you'd need to hold every day to land on your target on your end date.
The Progress Line (solid, indigo) is your actual cumulative miles — it climbs every time you log a run.
The space between those two lines is your pace position: above Trend, you're ahead; below it, there's a gap to close. (If you want the full breakdown, see The Two Lines: Reading the Pace Line Graph.)
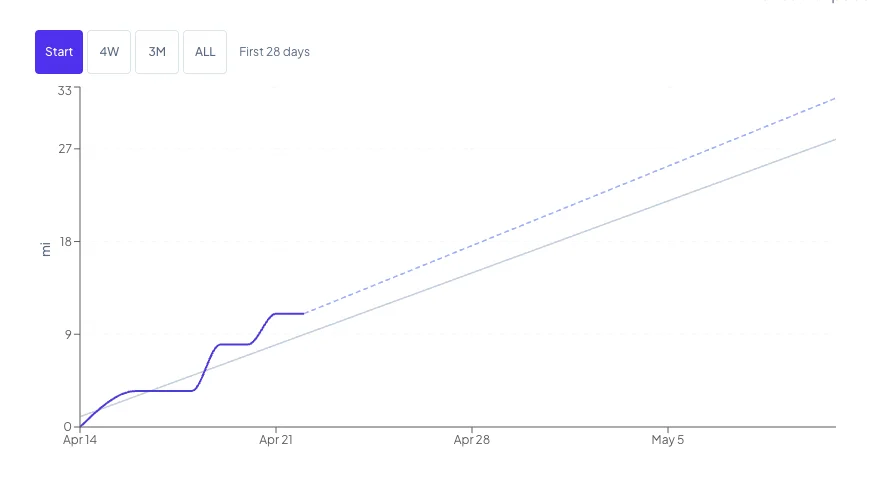
The Projection Line is the third line. It's different in two ways: it's dashed, and it's forward-looking. While the other two lines describe what has happened, the Projection Line describes where you're trending to finish.
When the Projection Line appears
It waits. Two conditions have to be true before it shows up:
- You've logged at least one run.
- At least 7 days have passed since your goal start date.
Until both are true, no Projection Line. You'll see the Trend Line and Progress Line, but not the dashed one.
The reason is honest: a projection based on 2 or 3 days of running would be nonsense. Imagine you run 5 miles on day 2 and nothing on day 3. A naive extrapolation would either predict 900+ miles by year end (5 miles every day forever) or 0 miles (you stopped already). Neither is useful. The product holds back until the math has something real to stand on.
Why the projection looks cautious in the first few weeks
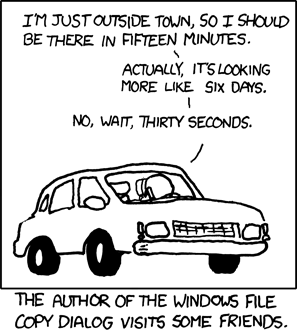
xkcd #612, "Estimation" — reprinted with permission per xkcd.com/about. Attribution: xkcd.com.
Once the Projection Line appears, it doesn't simply extrapolate your raw pace. It uses what's called a blended rate — a mix of two pieces of information:
- Your observed pace: how you've actually been running so far.
- Your target pace: the rate your goal requires.
The blend isn't fixed. It shifts as your goal unfolds. Early on, the projection leans heavily toward your target pace. Later on, it leans heavily toward your observed pace. In the middle, it's a mix.
Here's roughly how the weighting works across the life of a typical 365-day goal:
| Day | Approximate weight on observed pace |
|---|---|
| 7 | ~50% |
| 30 | ~58% |
| 100 | ~82% |
| 300 | ~93% |
So on day 7 of a year-long goal, the projection is about half your actual rate and half your target rate. By day 100, it's mostly your actual rate. By day 300, it's almost entirely your actual rate.
Behind the scenes, there's a weight that gradually shifts from about 0.5 on day 7 toward 1.0 as the goal unfolds. Shorter goals shift that weight faster — 30 days of data on a 60-day goal is more meaningful than 30 days of data on a year-long goal, and the math accounts for that. Longer goals smooth more aggressively.
Why this is a feature, not a bug
The blended rate is sometimes surprising. You might have an incredible first week — miles above pace — and notice that the Projection Line barely moves. Or you might have a rough first week and find that the projection is still pretty close to your original target.
Both behaviors are intentional. A few reasons:
One good week isn't a trend. Projecting from one hot week would fling the line into fantasy territory and then repeatedly revise it down as reality reasserts itself. The whiplash would make the projection feel unreliable.
One slow week isn't doom. The same logic cuts the other way. A light first week shouldn't signal to you that your goal is already cooked. You haven't gathered enough evidence yet.
Early projections should express uncertainty. When the data is thin, a good projection is humble. It says "based on what little I have, here's an estimate weighted toward what you told me you wanted." As more data accumulates, the projection gets more confident and shifts toward reflecting reality.
By the midpoint of your goal, the projection is mostly driven by your actual behavior. If it's ending above your target, that's meaningful. If it's ending below, that's meaningful too — and that's the cue that the gap-closure math in your coaching statement is worth acting on.
What the Projection Line is telling you late in the goal
As days remaining shrink, two things happen:
- The projection's weight on your observed pace creeps toward 100%. It's almost a pure extrapolation.
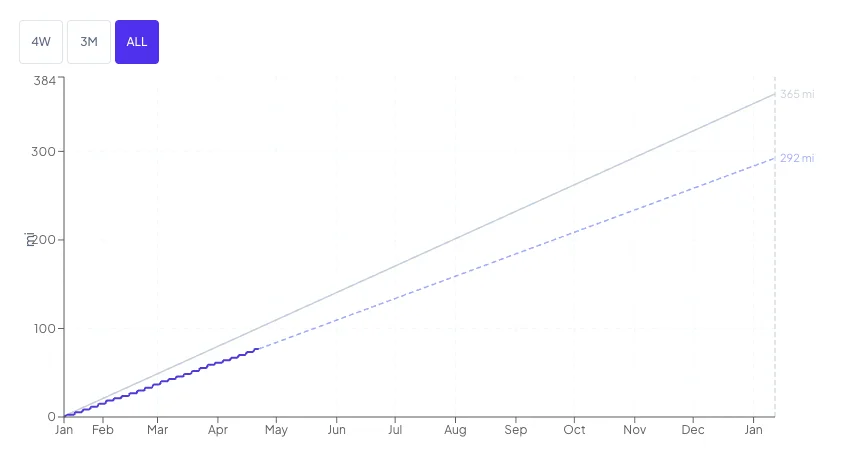
- The chart gives you a quietly honest forecast. If it's ending at 340 miles on a 365-mile goal, that's not a discouraging guess — that's a realistic estimate of where you'll land at your current rate.
And that's exactly when the forecast is most useful. There's still time to log more miles and change the outcome — and now the projection is giving you a reliable baseline to measure against.
When the Projection Line goes away
When your goal end date passes, the Projection Line disappears. There's nothing left to project. Your dashboard switches to a completion summary: final miles logged, whether you hit the target, the goal dates. A prompt appears to start a new goal whenever you're ready.
One more thing to note: if you exceed your goal before the end date, nothing breaks. The Progress Line keeps climbing above the Trend Line, and the Projection Line keeps doing its job right up to your goal end date. There's no dead-end or blocked state. Keep logging runs if you want to.
The short version
The Projection Line is the product's best estimate of where you're going to finish. It waits 7 days because not projecting at all is better than projecting from noise. It starts out cautious because early data isn't meaningful, and it gets progressively more honest as you accumulate real behavior.
If it's sitting close to the Trend Line early in your goal, that's the projection telling you it doesn't know enough yet. If it's above or below your target later in your goal, the projection is telling you something real.
Either way, the space between your Progress Line today and your Projection Line's endpoint tomorrow is the thing worth watching. That's where the next run matters.
RunnersRun - It's what we do.